Where the bad loans were.
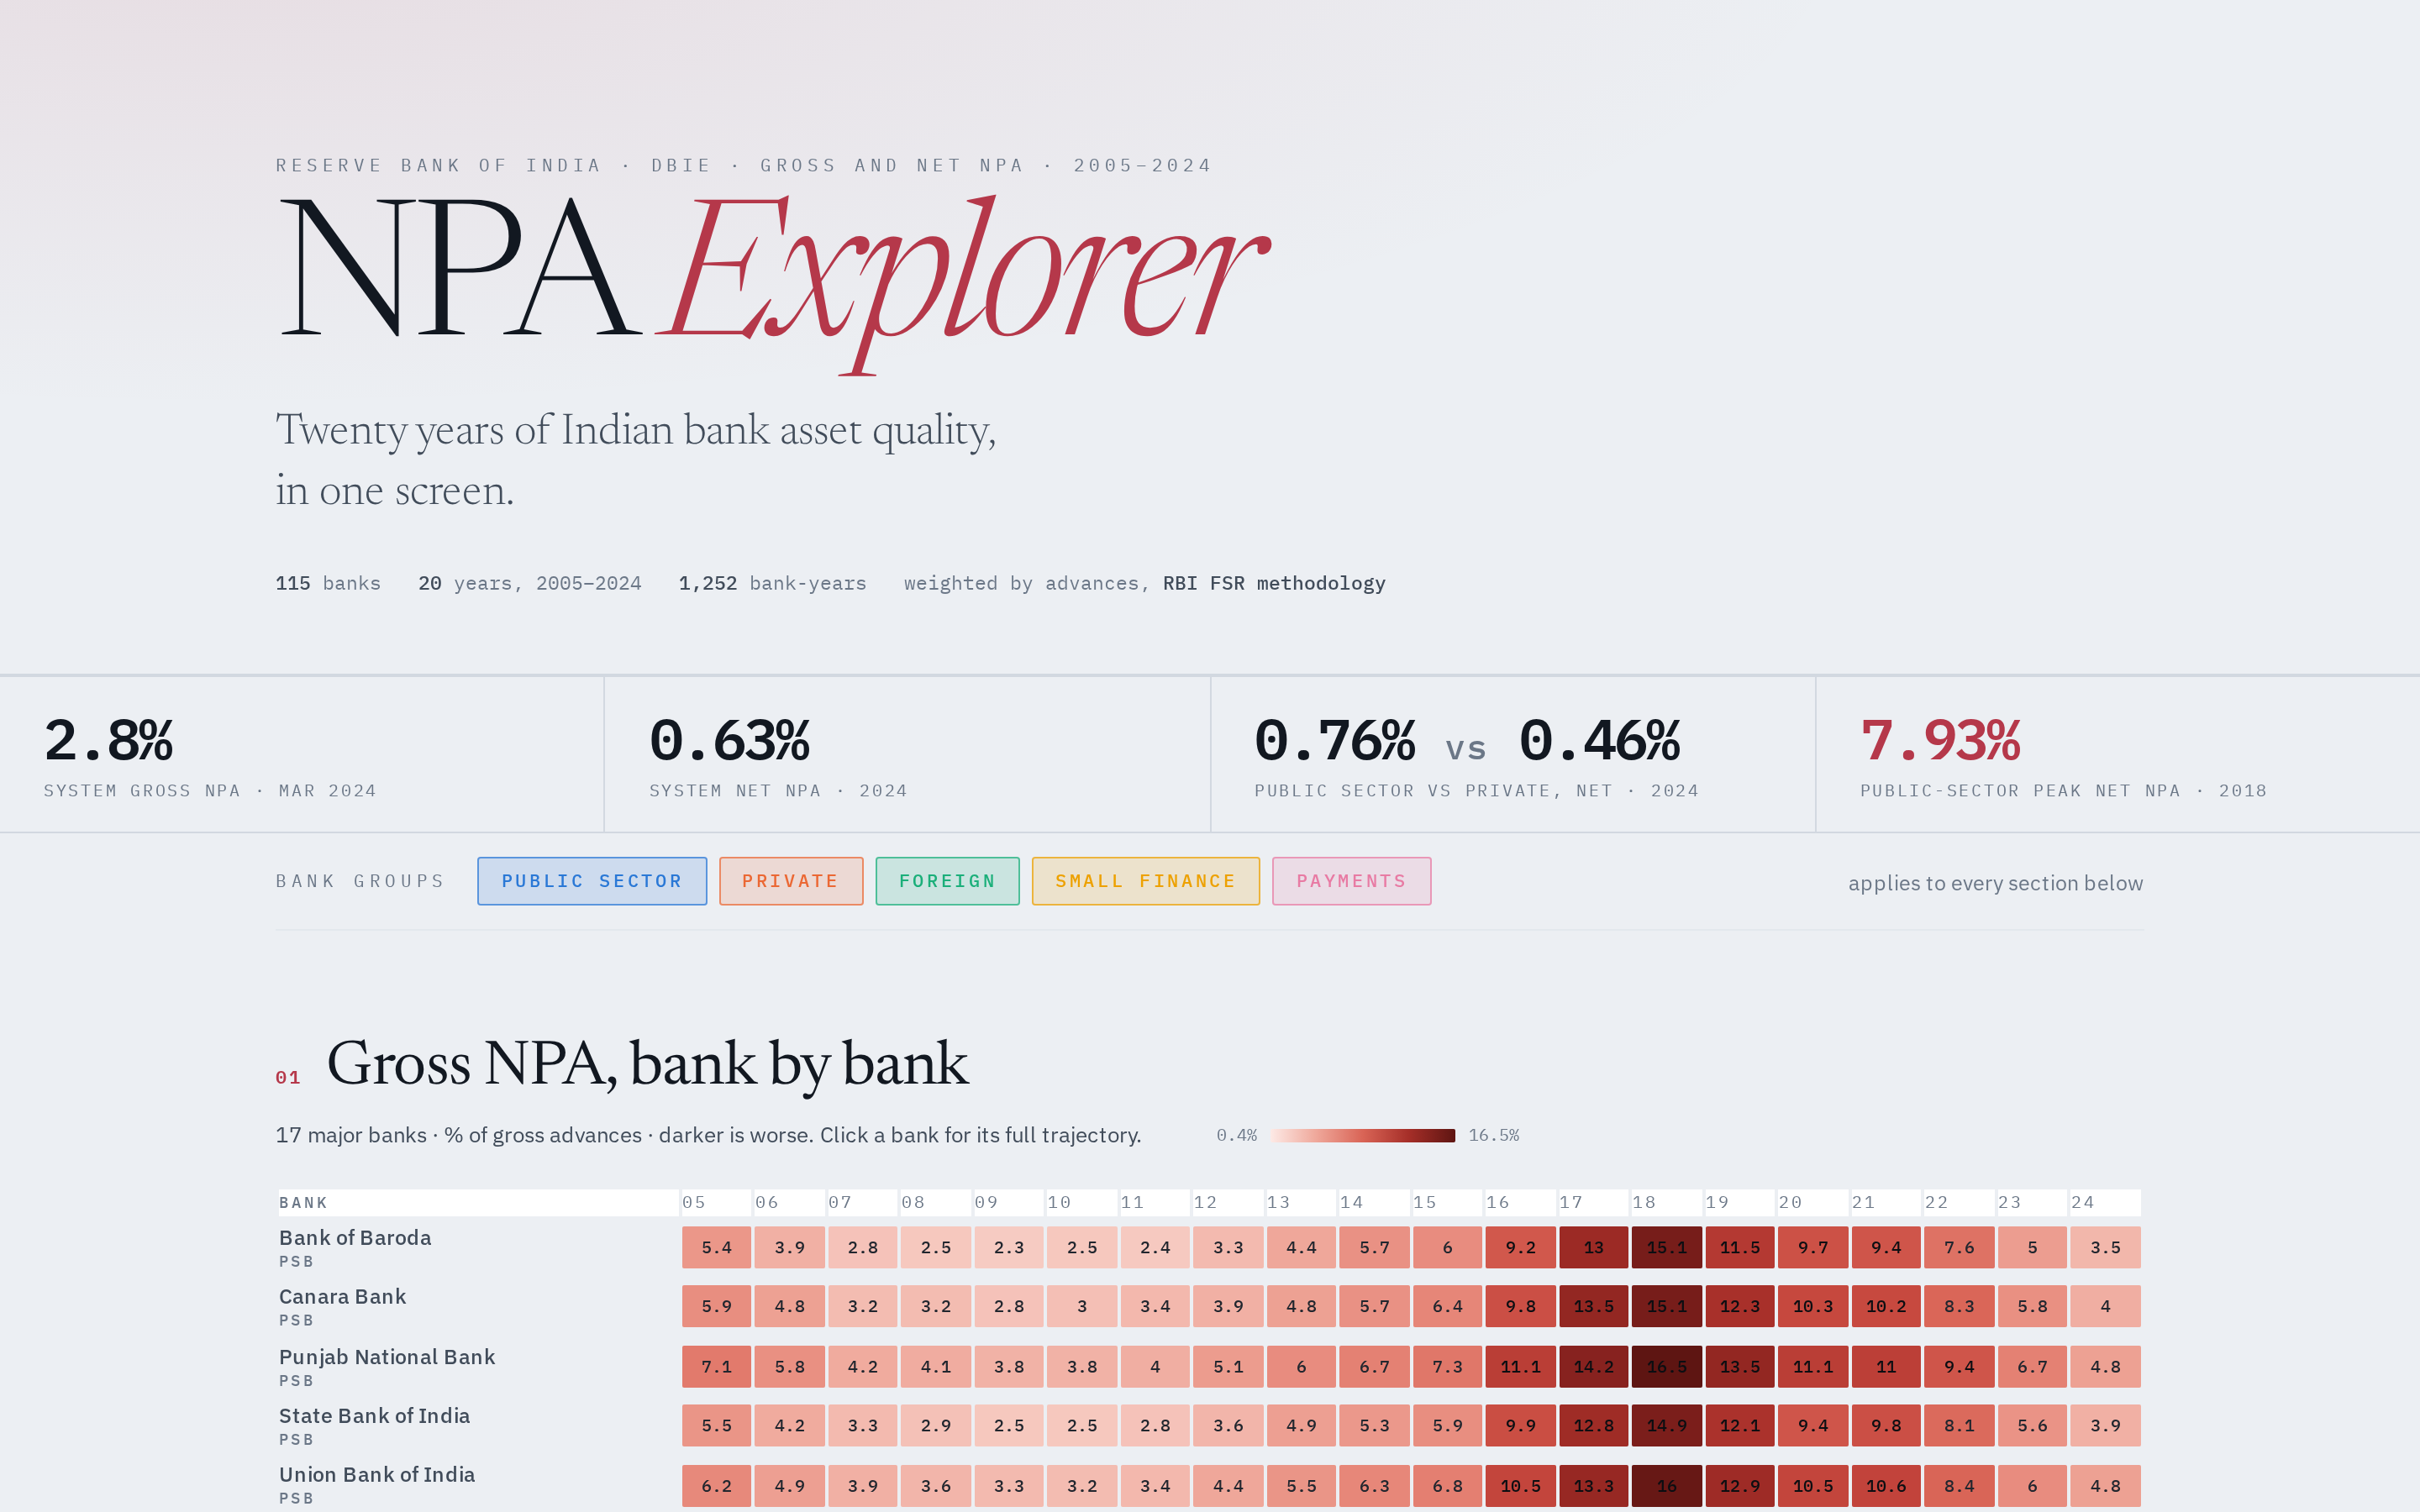
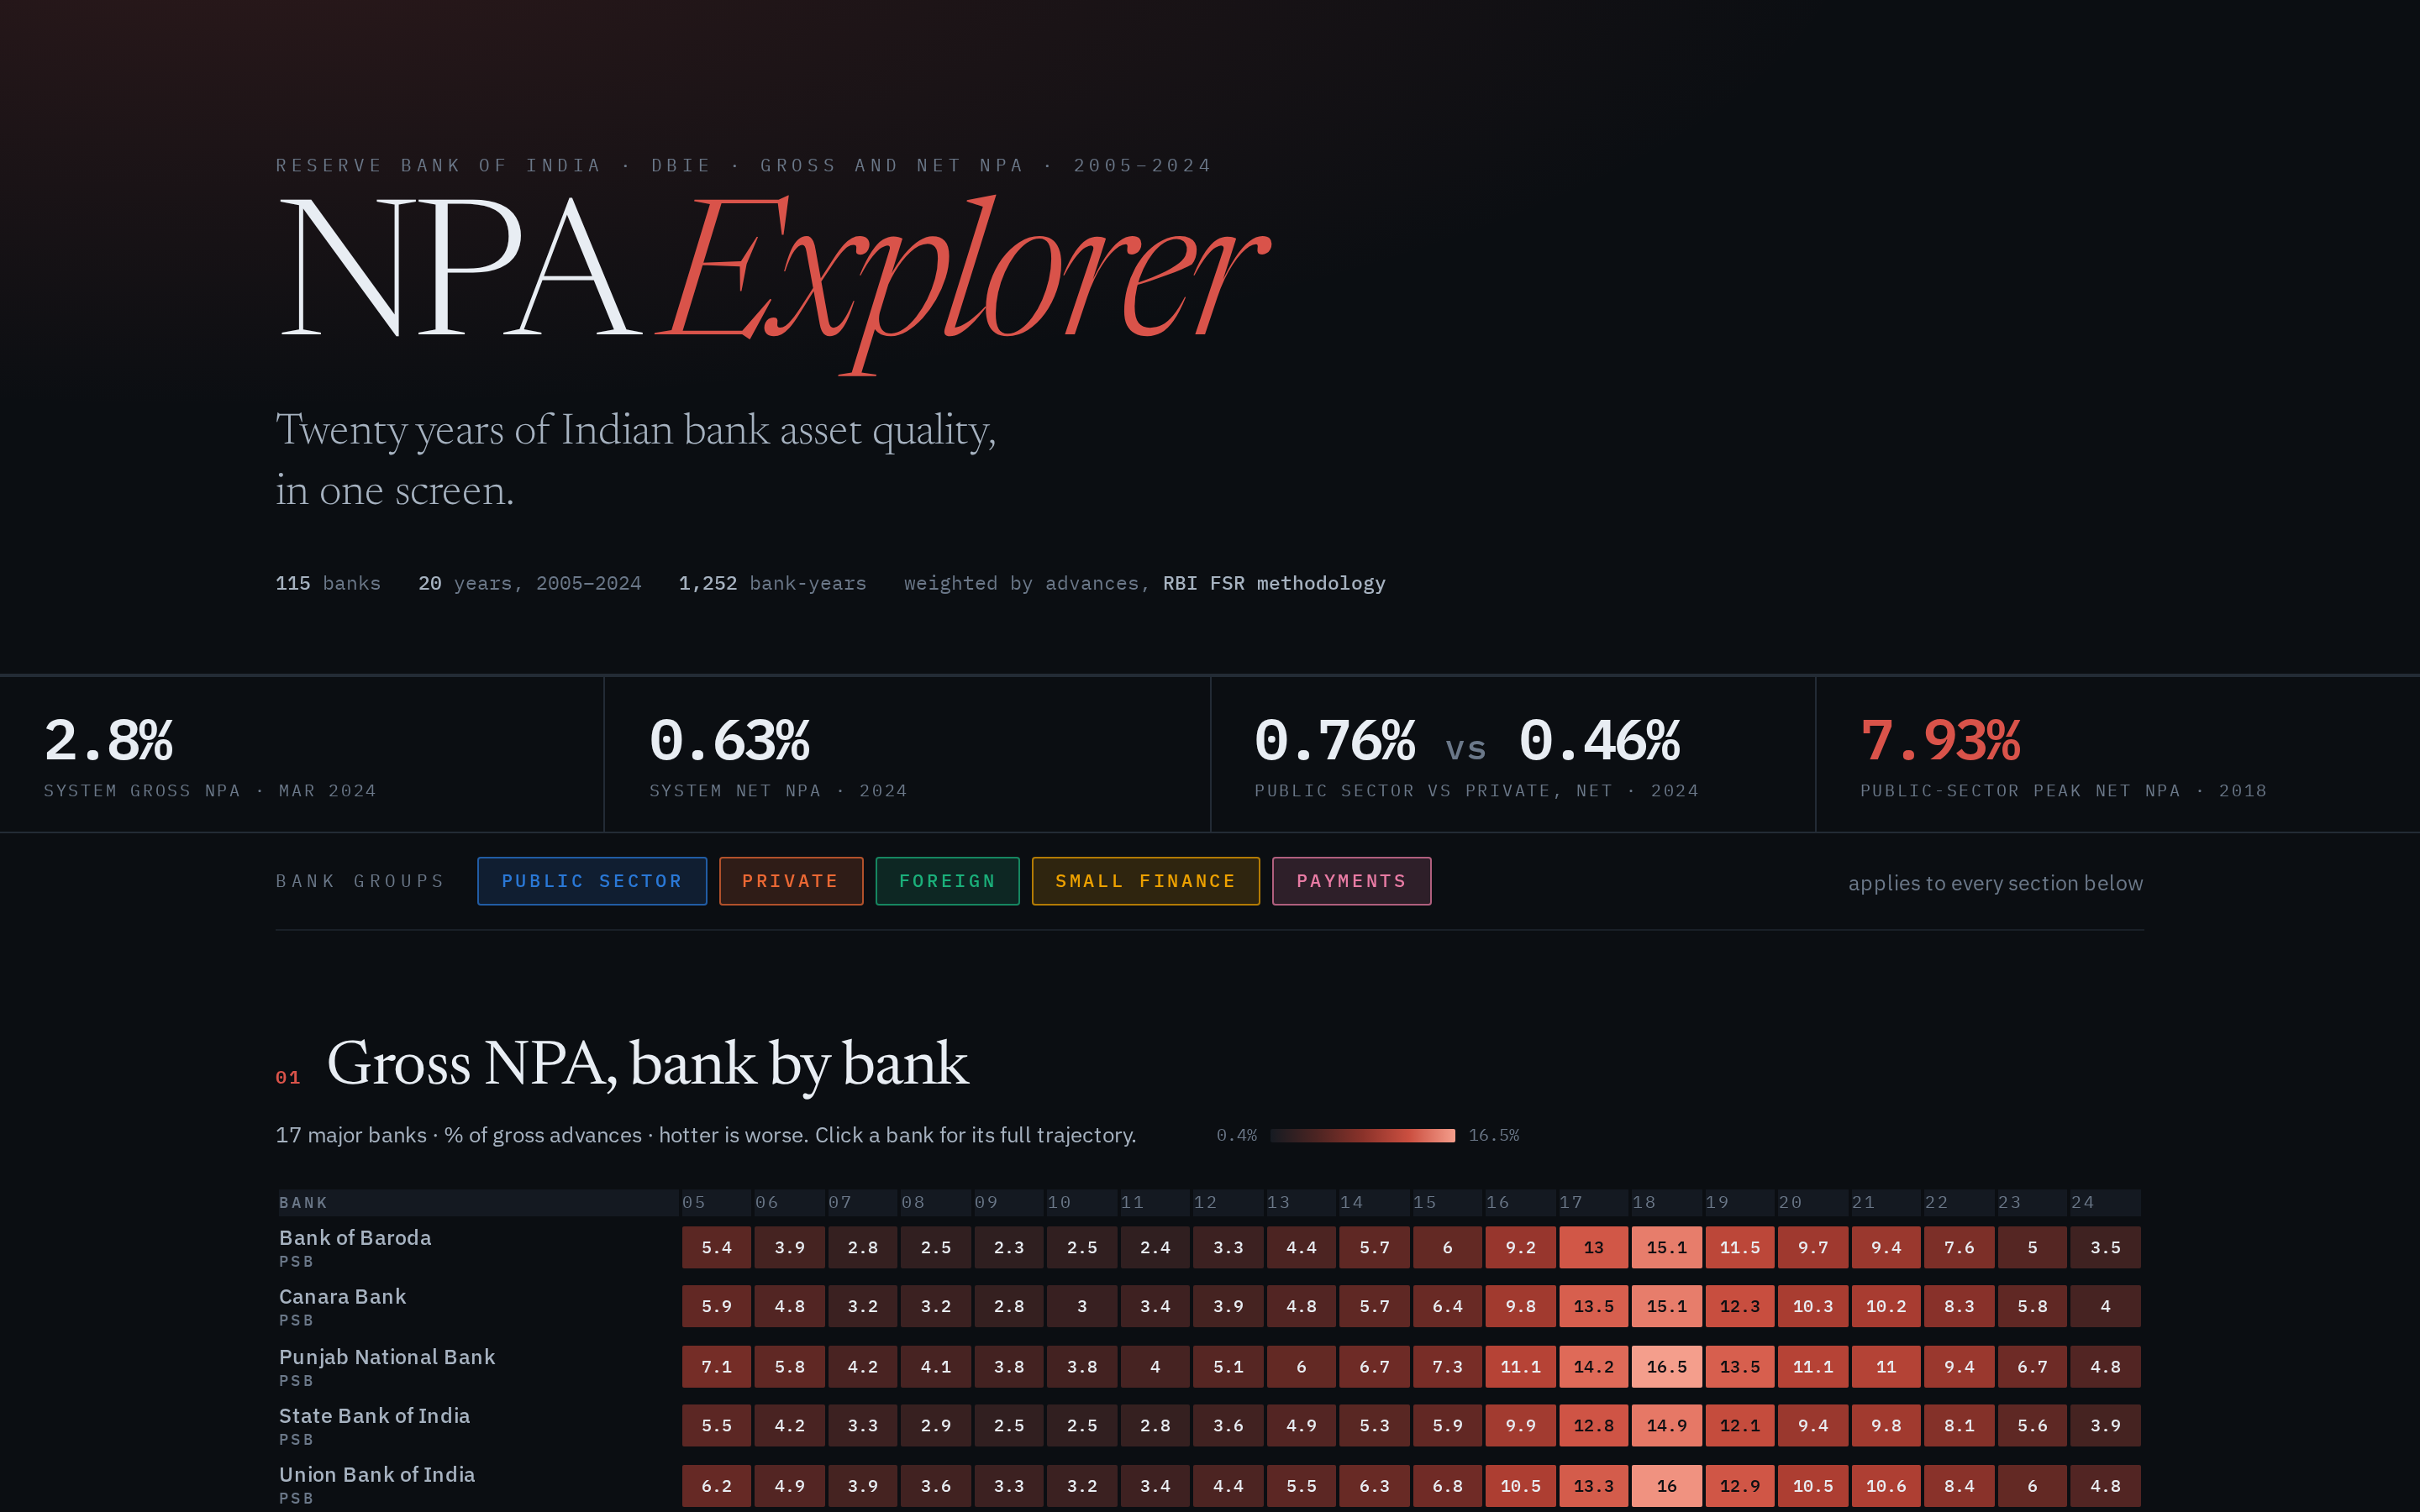
Gross and net NPA for 115 Indian banks from 2005 to 2024, straight from RBI DBIE. A heatmap to find the period that matters, then a drill-down into any single bank. Group averages are advances-weighted, matching the methodology the RBI's own Financial Stability Report uses — an unweighted mean lets a tiny bank move the public-sector line.
Built three times
This started as a heatmap, became a net-NPA explorer, and ended up as one app doing both. The two earlier versions are retired rather than deployed alongside it — three URLs showing almost the same thing is how a portfolio stops meaning anything.
Colour that survives colour blindness
The group palette was checked for perceptual distance in both normal and colour-vision-deficient simulation, and the heatmap ramp is sequential rather than a rainbow, so darker always means worse and nothing depends on telling red from green.